
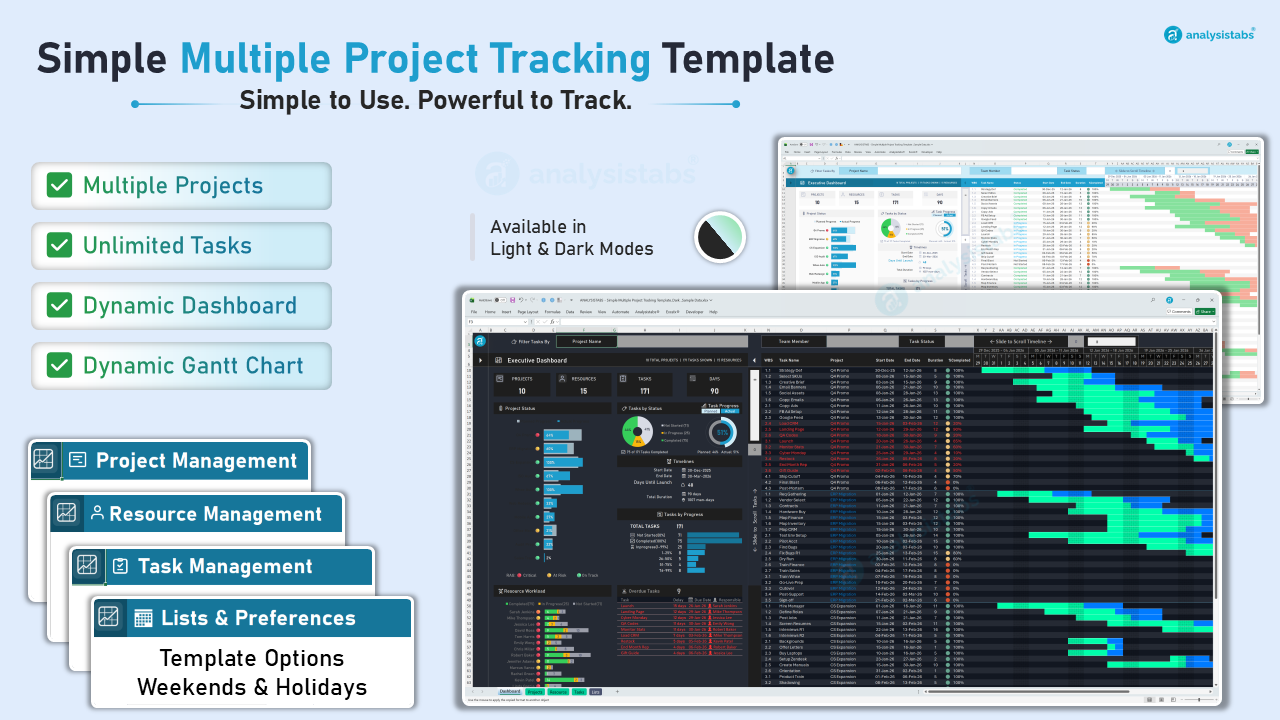
Simple Multiple Project Tracking Template – User Guide
How to set up, fill in and use the Simple Multiple Project Tracking Template v3.0. Set it up once, then keep the Projects, Resource and Tasks tables up to date – the Executive Dashboard, Gantt chart, alerts and charts update themselves.
Version 3.0Released 22 Oct 2026Excel 2016+ · Win & MacNo macros
Requirements · Quick start · Sheet guide · Dashboard · Gantt chart · Entering data · Settings · Light & Dark mode · Troubleshooting · FAQ · Upgrading from v2 · Version history
Requirements
- Excel 2016, 2019, 2021, 2024 or Microsoft 365 on Windows or Mac. Google Sheets, Apple Numbers and Excel Online in a browser are not supported.
- A standard
.xlsxworkbook – no macros, no add-ins. Every formula is visible and editable. - Calculation mode must be Automatic (Formulas › Calculation Options). If numbers look stale, press
F9. - You receive two files: a Sample Data edition (15 projects, 20 people, 250+ tasks) to explore every feature and a Blank edition to start your own portfolio.
Quick start – 6 steps
- 1Set your calendarSettings sheet: tick your weekend days and enter company holidays (US 2026–27 holidays are pre-filled – edit or replace them). Every end date and the Gantt skip these days.
- 2Check the optionsSettings › Template Options: Edit Mode highlights input cells; Progress Display chooses traffic-light icons or data bars. Status Thresholds set when a project turns Amber or Red, the upcoming-deadline window and workload limits.
- 3Add your teamResource sheet: enter each person's Employee ID and Name. Workload, task counts and progress are calculated for you.
- 4Add your projectsProjects sheet: enter Project ID and Project Name. Start, end, duration, progress and RAG status fill in automatically from the tasks.
- 5List your tasksTasks sheet: Task ID, Project, WBS, Task, Responsible, Start Date, Days Required (working days – enter 0 for a milestone), Status and Progress %. End Date and Planned Progress calculate themselves.
- 6Open the DashboardUse the Project, Team Member and Task Status filters, switch the Gantt between Day, Week and Month, and tick 🌙 Dark for the dark theme.
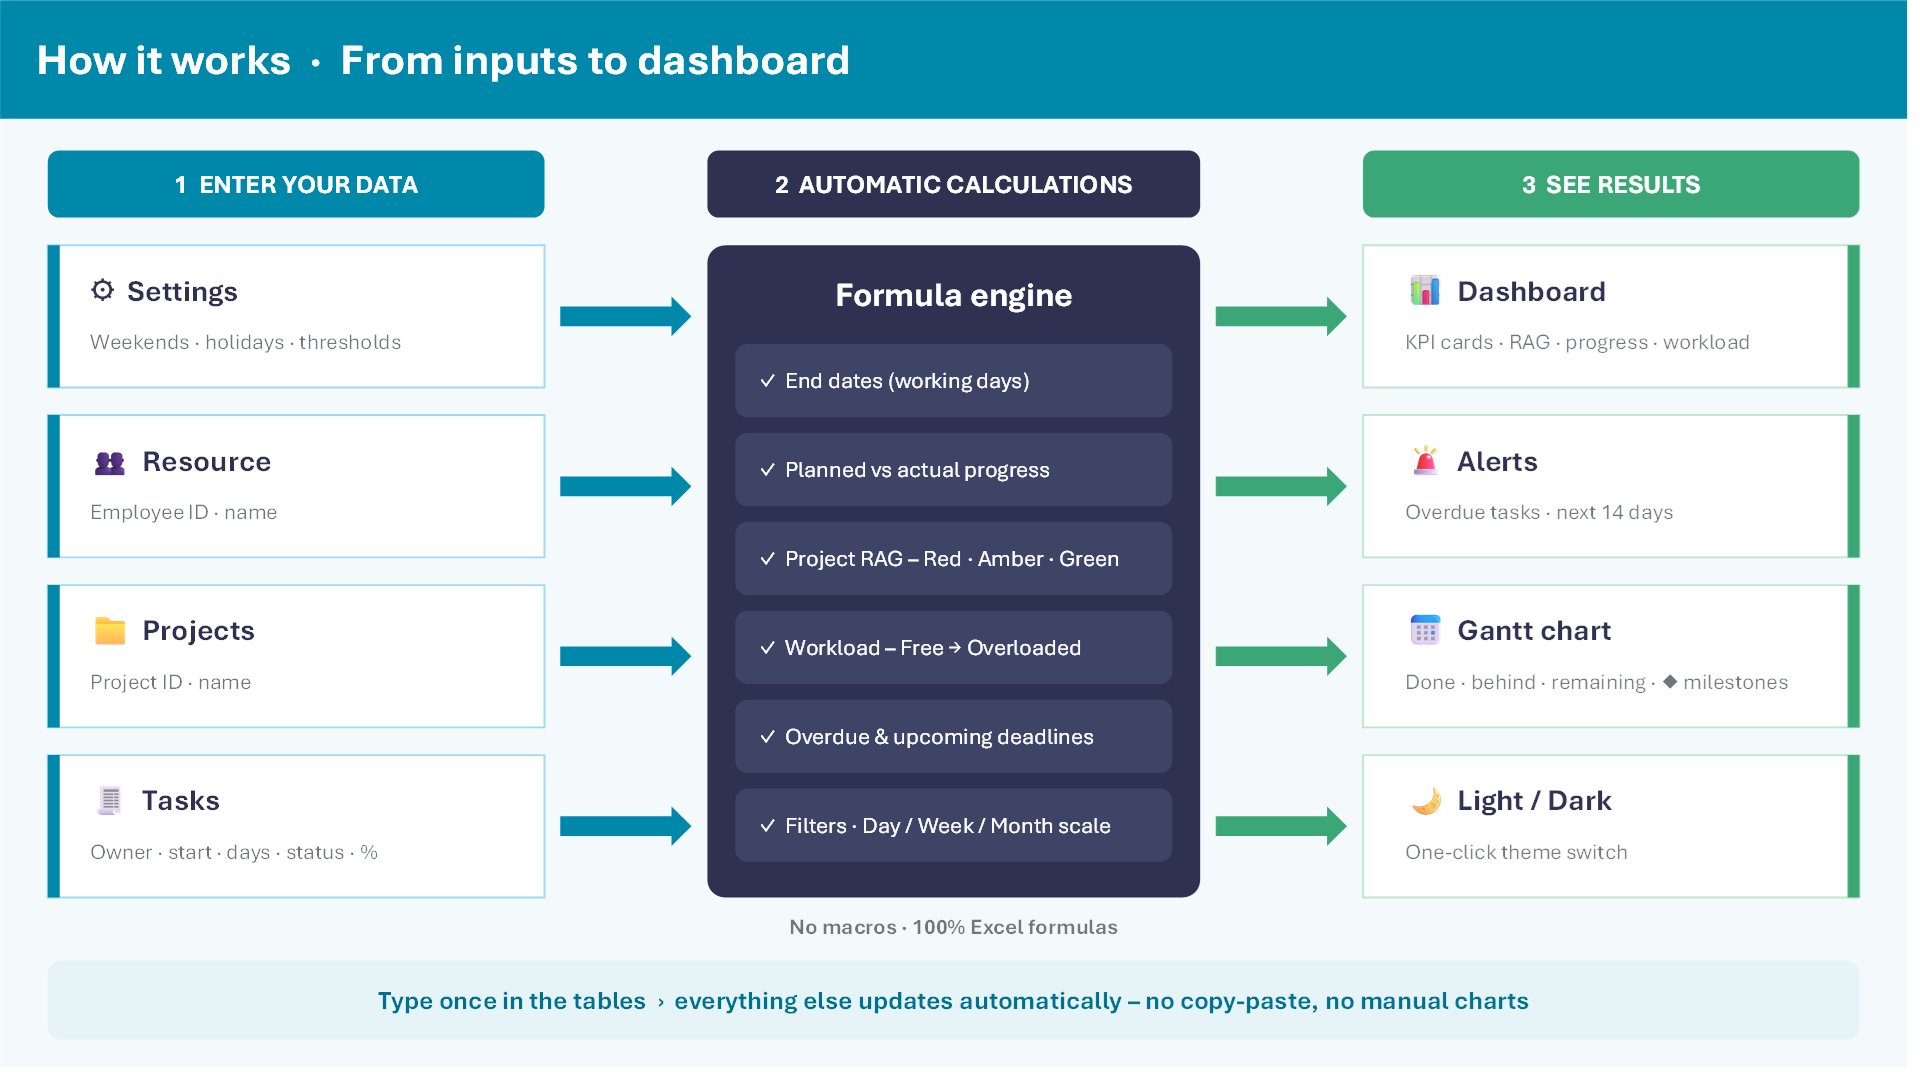
How the data flows
You only type in the Settings, Resource, Projects and Tasks sheets. The formula engine calculates end dates, progress, RAG, workload and deadlines, and the Dashboard, alerts and Gantt chart update automatically.
Sheet guide
| Sheet | What it's for |
|---|---|
| Dashboard | Executive dashboard: KPI cards, project status (RAG), task status, progress ring, timelines, overdue and upcoming deadlines, team workload, task list and multi-scale Gantt chart. |
| Projects | Project register – type the ID and name; everything else is calculated. |
| Resource | Team register – type the ID and name; workload status and task counts are calculated. |
| Tasks | Task list – the main data-entry sheet. Up to 500 task rows. |
| Settings | Template options, status thresholds, Gantt preferences, weekends and holidays. |
| ReadMe | Quick-start notes, tips and support links. |
| License | Terms of use. |
| Calculations | Helper formulas that feed the dashboard – no input needed; please don't edit. |
Dashboard
The Dashboard is the only sheet you need day to day. It reads the three data tables and updates as you type.
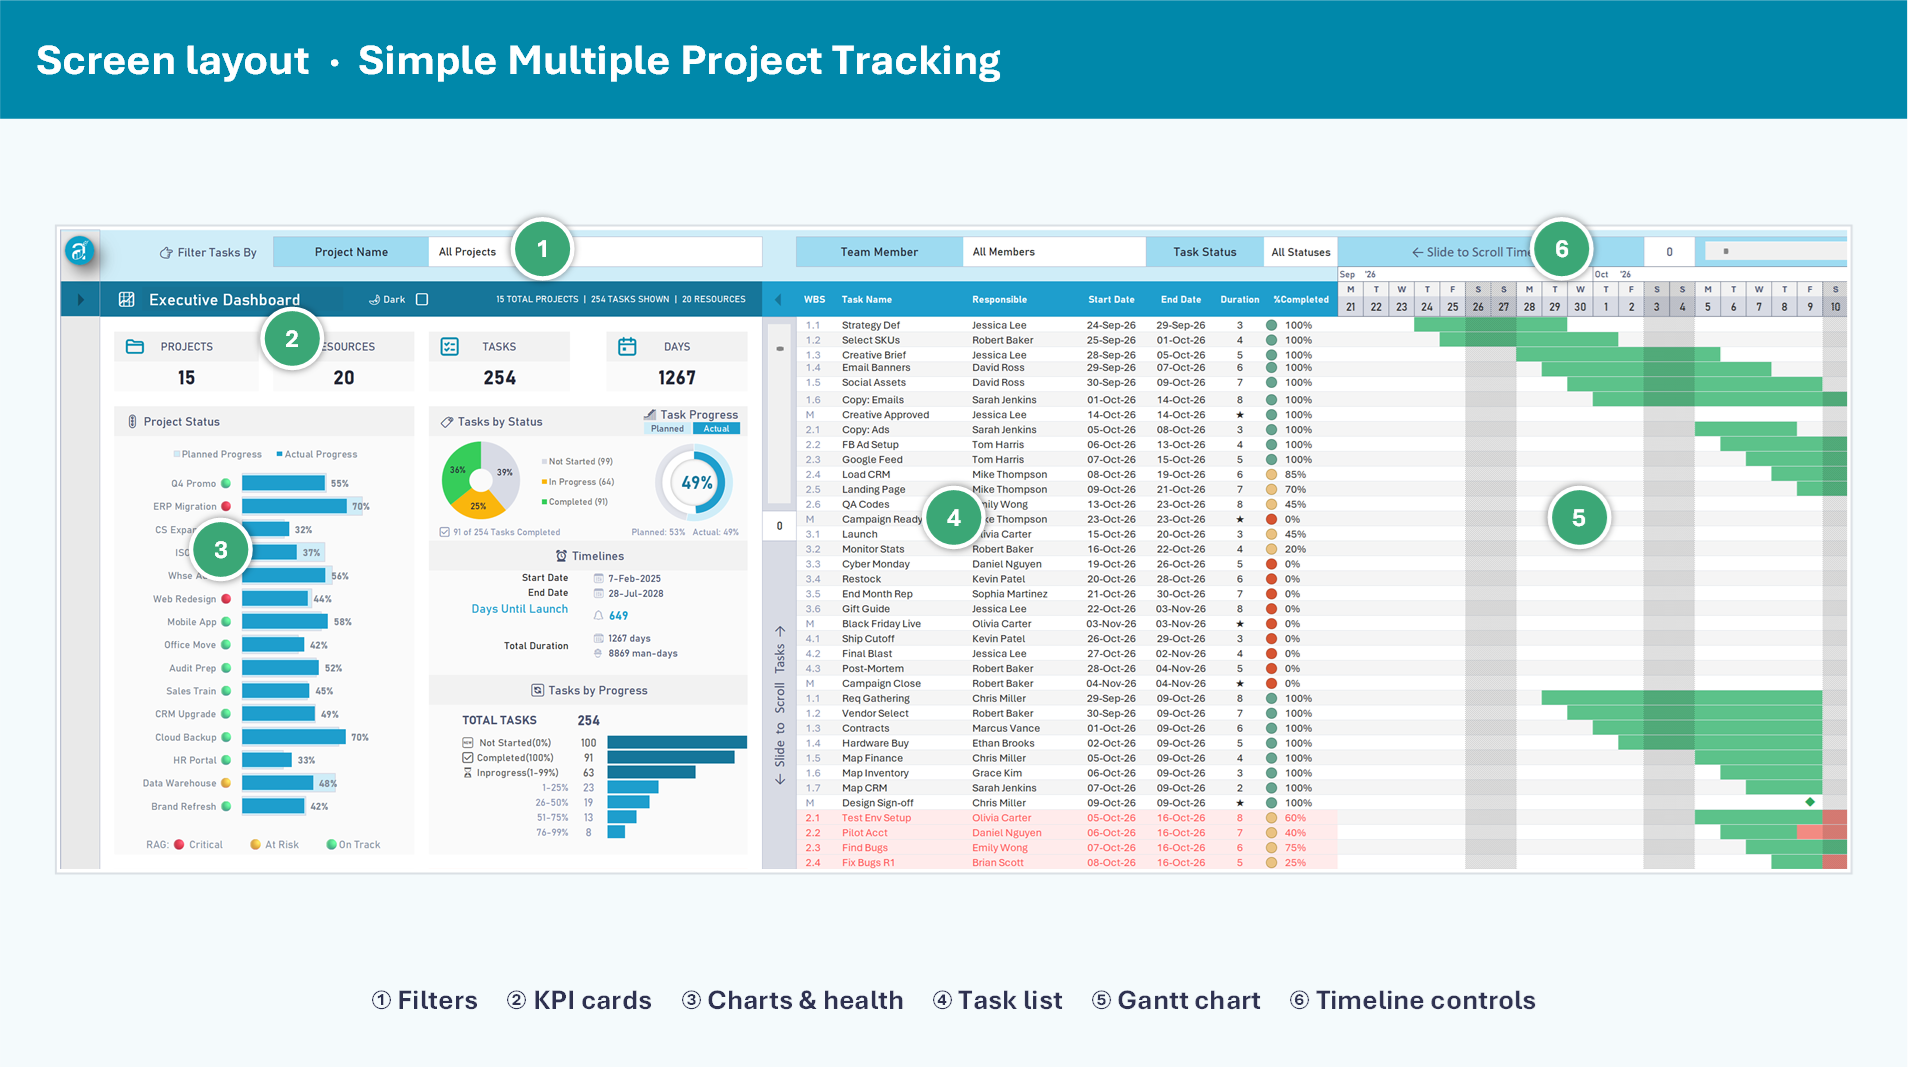
Header & filters
- Project Name, Team Member, Task Status – dropdowns at the top; each starts with an All option. A filter cell turns cream when a real filter is applied.
- The title changes to Dashboard: <Project> plus its RAG colour when one project is selected.
- The summary line shows total projects, tasks shown and resources. Tick 🌙 Dark in the title bar to switch theme.
KPI cards & charts
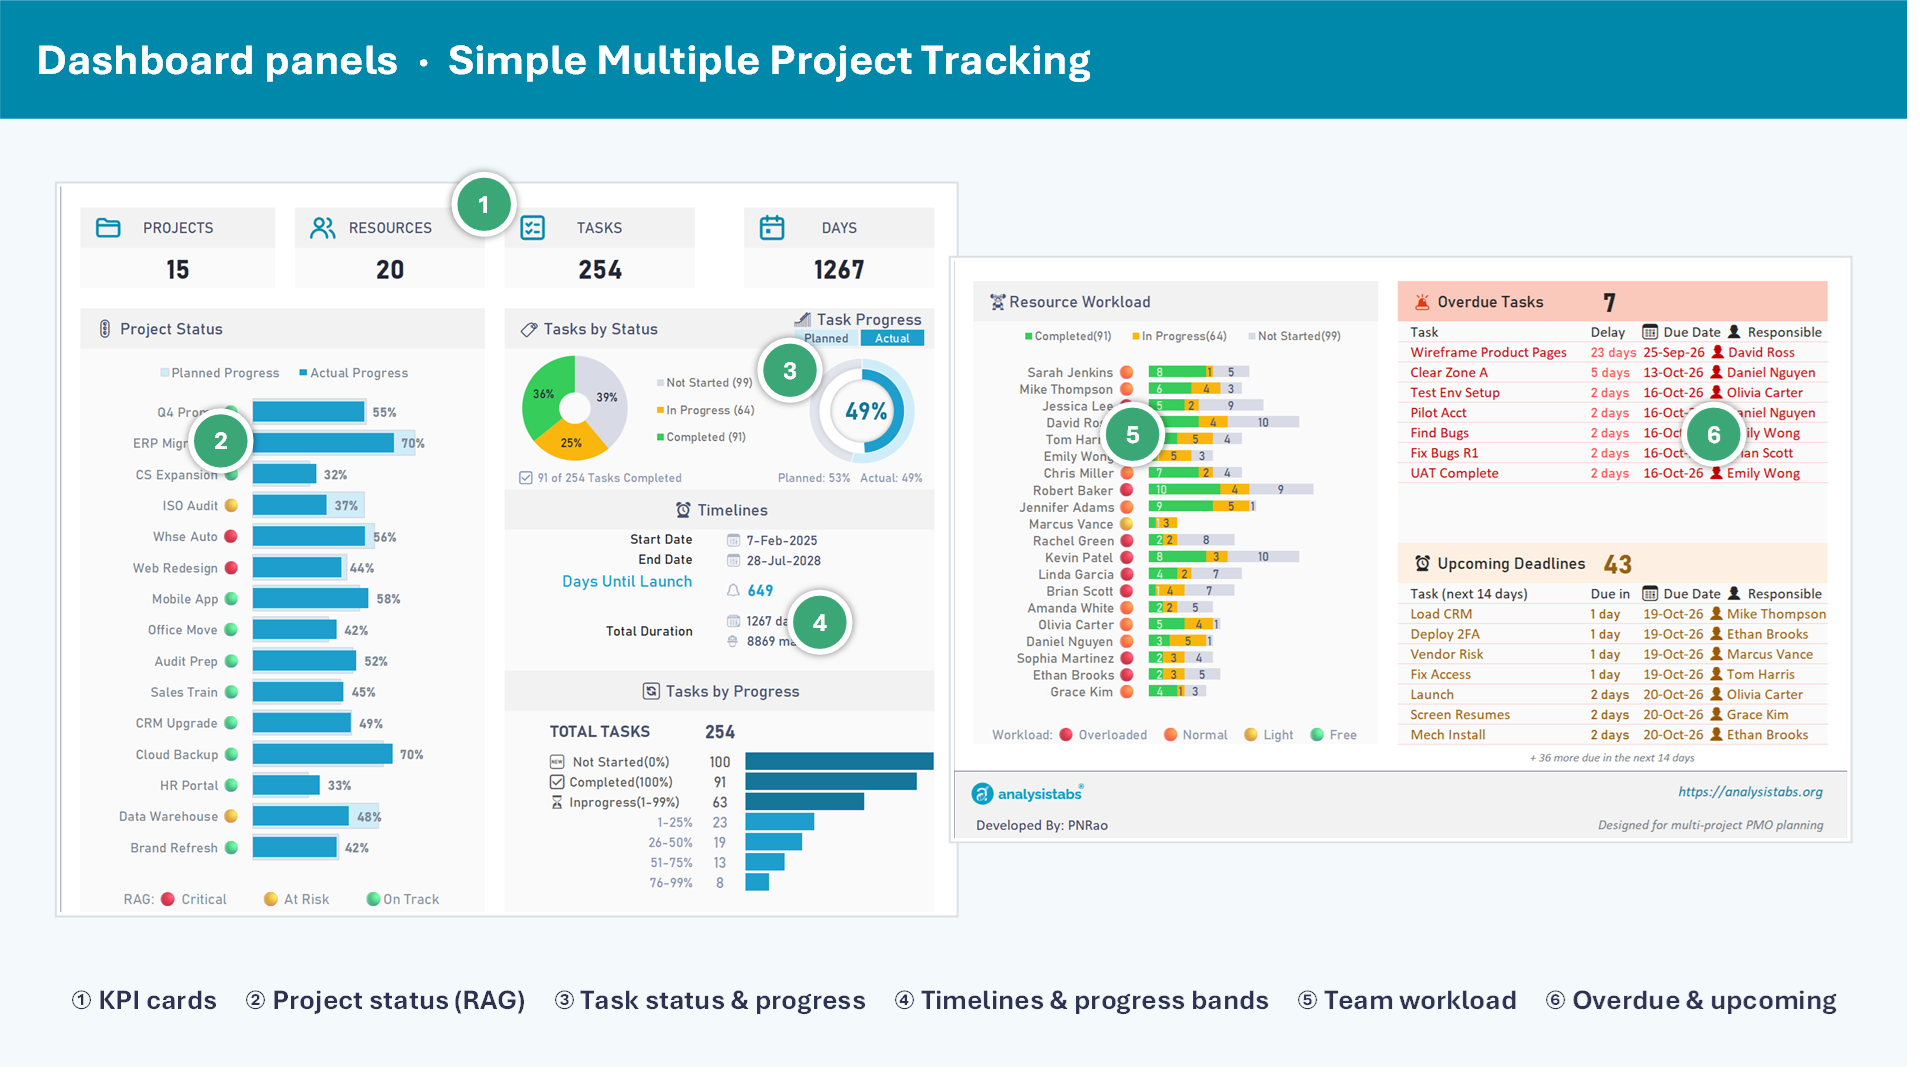
- KPI cards – Projects, Resources, Tasks and total Days for the current filter.
- Project Status – planned vs actual % for every project, with a Red / Amber / Green dot.
- Tasks by Status – Not Started / In Progress / Completed doughnut and an actual vs planned progress ring.
- Timelines – start date, end date, days until launch and total duration.
- Tasks by Progress – how many tasks are at 0%, 1–25%, 26–50%, 51–75%, 76–99% and 100%.
- Resource Workload – completed, in-progress and not-started tasks per person, with a workload dot.
Alerts
- 🚨 Overdue Tasks – unfinished tasks past their end date, sorted by due date, with days late and owner (first 8 shown, “+ n more” note).
- ⏰ Upcoming Deadlines – unfinished tasks due in the next 14 days (set in Settings), soonest first.
Task list
- Shows 60 tasks at a time – drag Slide to Scroll Tasks to move through all of them. A caption shows “Showing a–b of n tasks”.
- The third column can show Responsible, Project or Status (dropdown in its header). Status shows coloured dots: ● Completed, ● In Progress, ● Not Started.
- %Completed shows traffic-light icons or green data bars (Settings › Progress Display). Milestones show ★ in Duration.
- Overdue rows are highlighted; a line separates each project.
Gantt chart
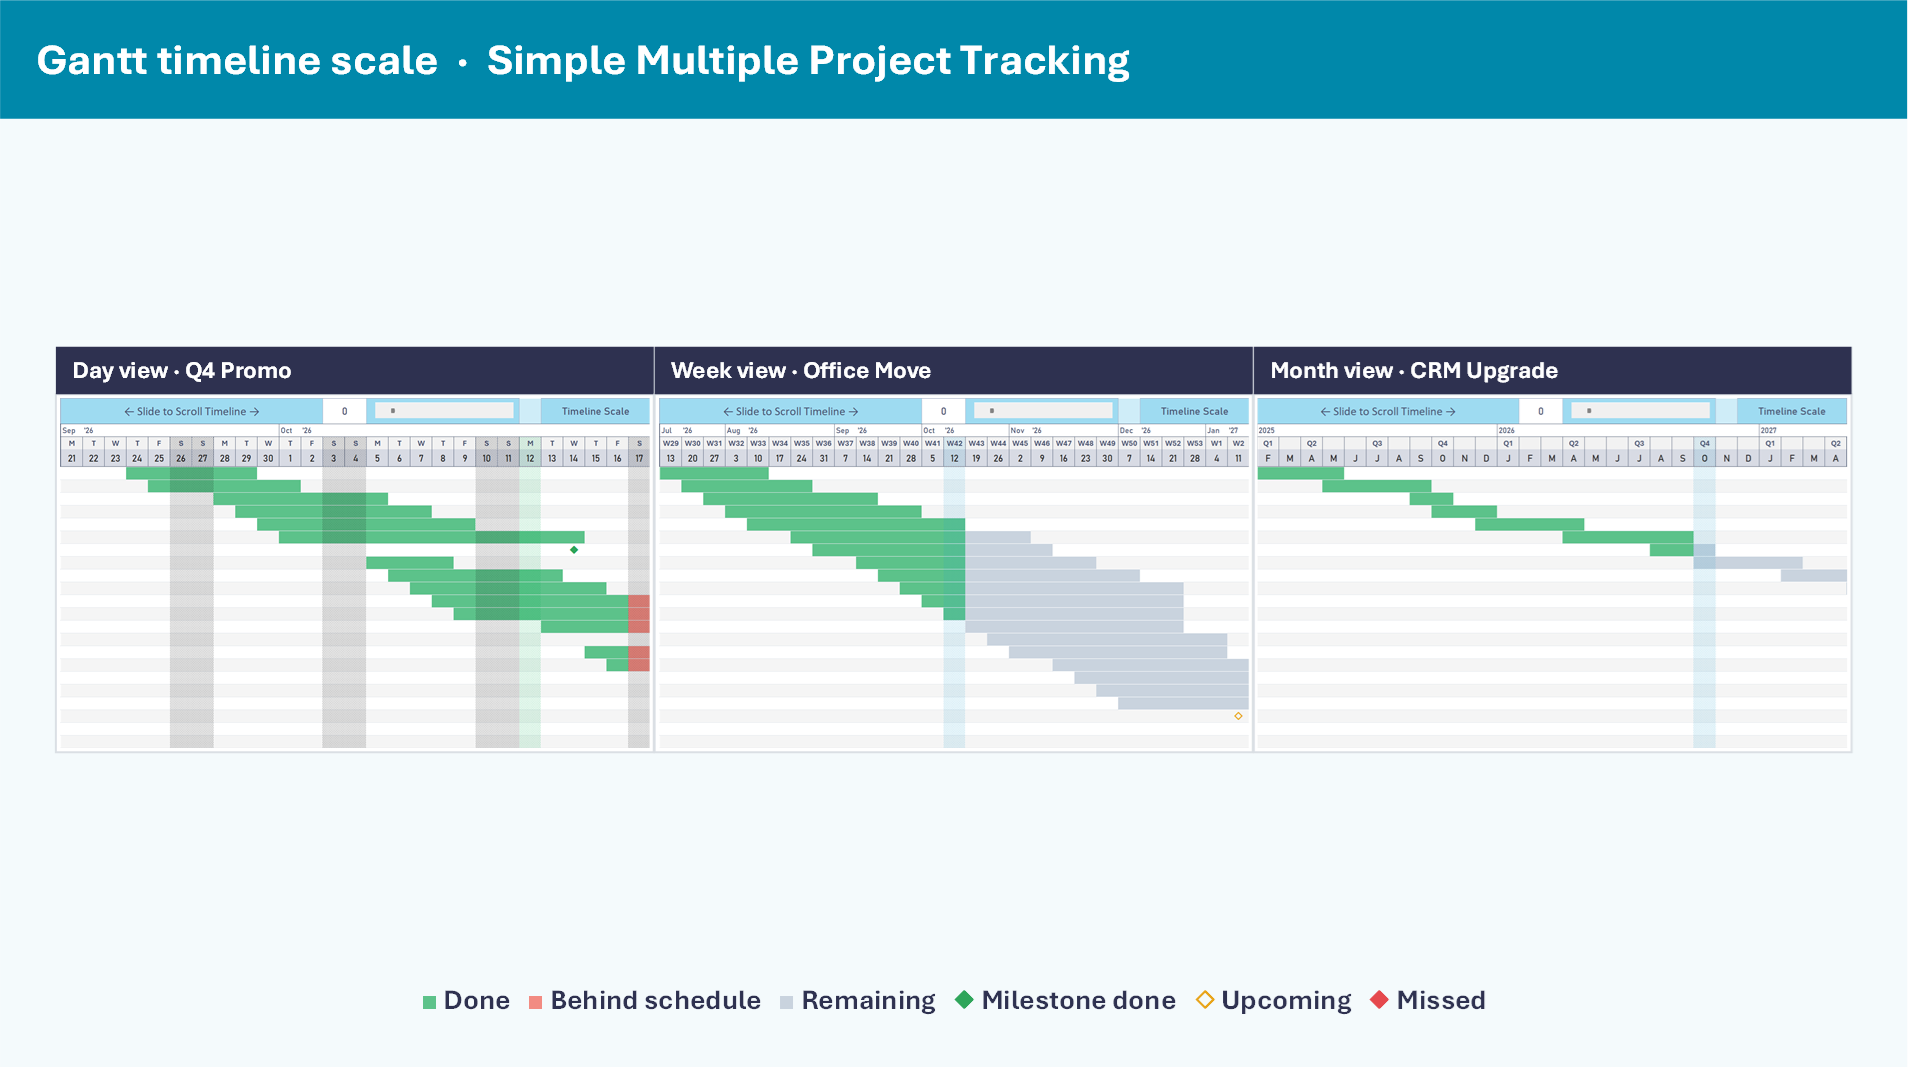
Timeline Scale
Choose Day, Week or Month. 63 columns cover about 9 weeks, 14 months or 5 years.
Scroll the timeline
Drag Slide to Scroll Timeline. With All Projects selected the chart opens just before today; with one project it opens at the project start.
Bar colours
Green = done, coral = behind schedule (more than the Behind tolerance), slate = still to do. Colours follow the theme.
Milestones
Tasks with 0 days show as ◆ done (green), ◇ upcoming (amber) or ◆ missed (red).
Highlights
Today's column, weekends and holidays are shaded (Day view). Each can be switched off in Settings.
Load strip
The row under the Gantt counts Active Tasks, Tasks Due or Due & Pending per period – choose with the Timeline row dropdown.
Entering data
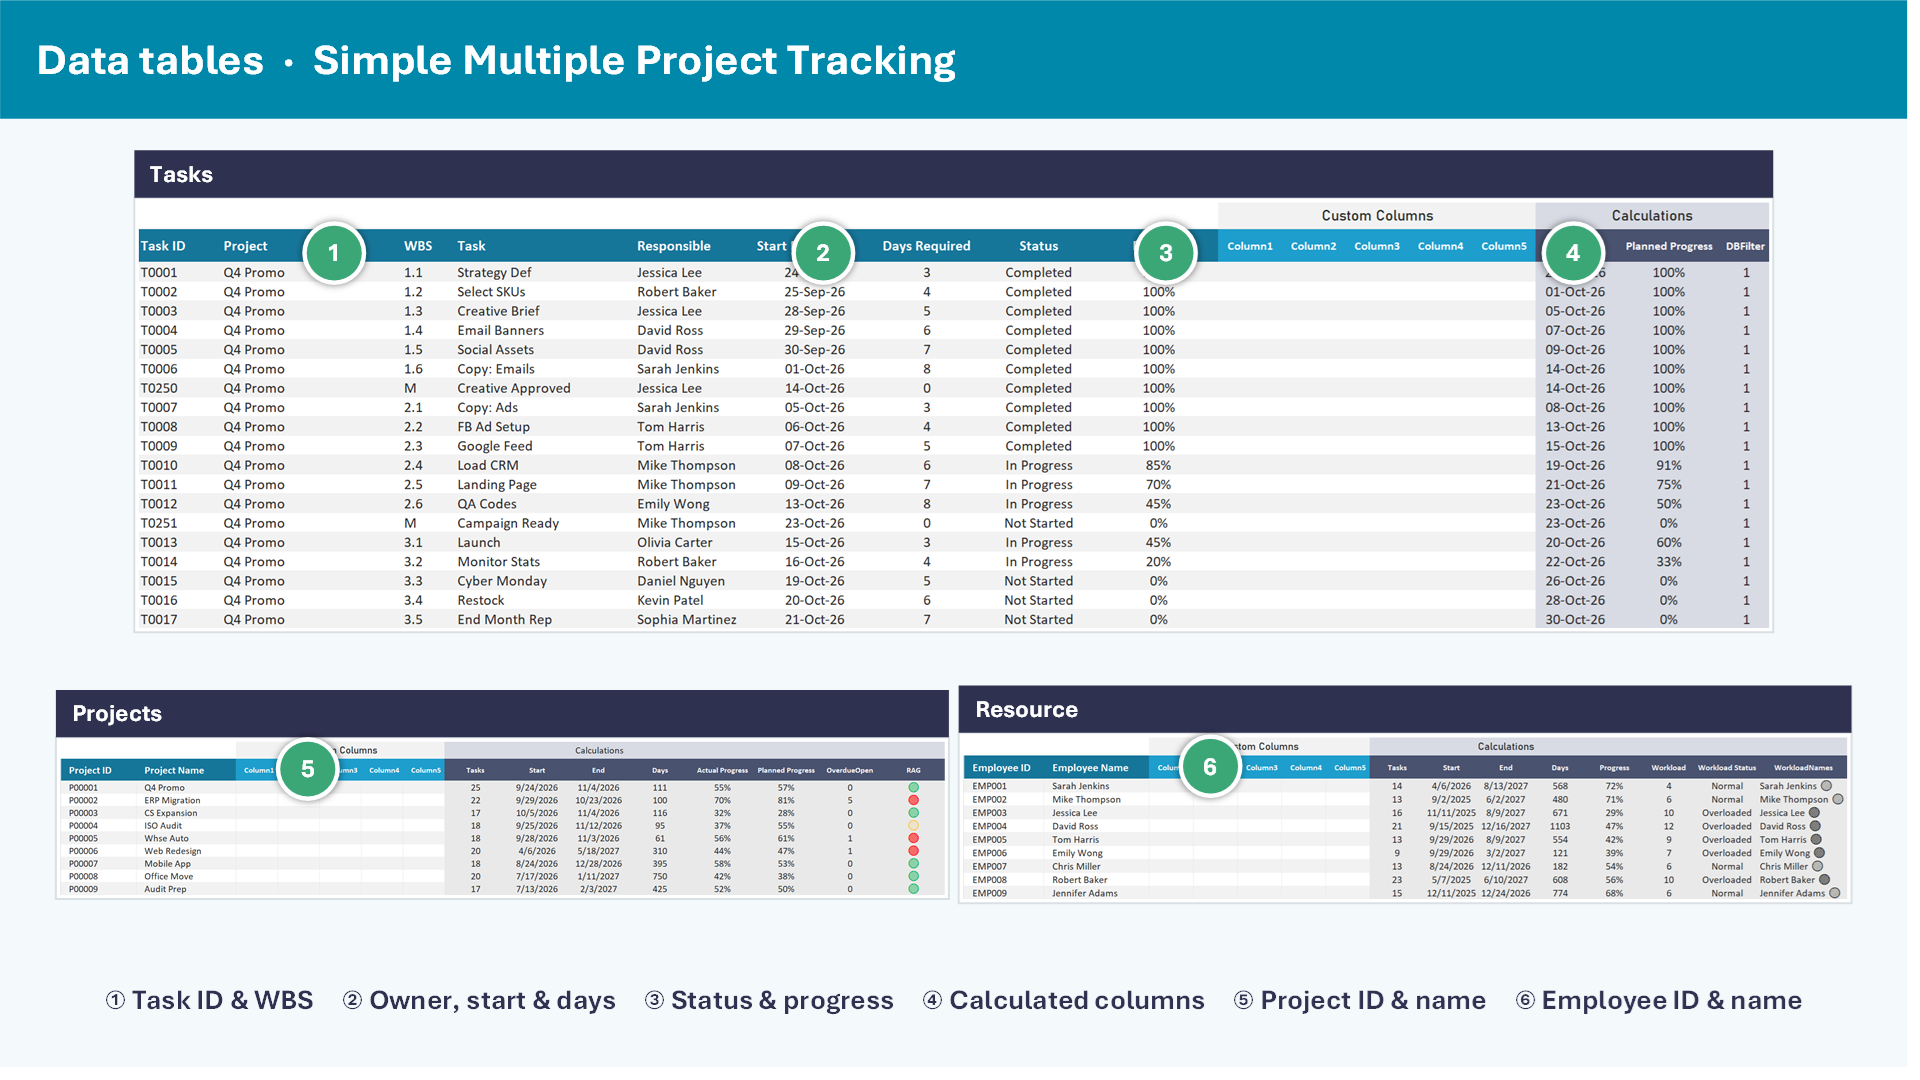
Type in the first empty row
Each table has spare rows ready (Tasks: 500). Formulas in the calculated columns fill themselves.
White = input, shaded = formula
Only type in the input columns. Turn on Edit Mode (Settings) to highlight them.
Use the dropdowns
Project, Responsible and Status are dropdowns, so names always match.
5 custom columns
Column1–Column5 in every table are yours – rename the headers and use them for anything.
Tasks sheet
| Column | What to enter |
|---|---|
| Task ID | Any unique code, e.g. T0001. |
| Project | Pick from the dropdown (comes from the Projects sheet). |
| WBS | Phase.task number such as 1.2, or M for a milestone. |
| Task | Short task name. |
| Responsible | Pick a team member (from the Resource sheet). |
| Start Date | First working day of the task. |
| Days Required | Working days, 0–3650. 0 = milestone (◆ on the Gantt, ★ in the list). |
| Status | Not Started, In Progress or Completed. |
| Progress | 0%–100%. |
| End Date · Planned Progress | Calculated – end date skips weekends and holidays; planned % is based on today's date. |
Projects sheet
- Enter Project ID and Project Name only.
- Calculated: number of tasks, start, end, total days, actual progress, planned progress, overdue count and RAG status.
Resource sheet
- Enter Employee ID and Employee Name only.
- Calculated: tasks, start, end, days, progress, open-task workload and Workload Status – Free, Light, Normal or Overloaded.
Settings
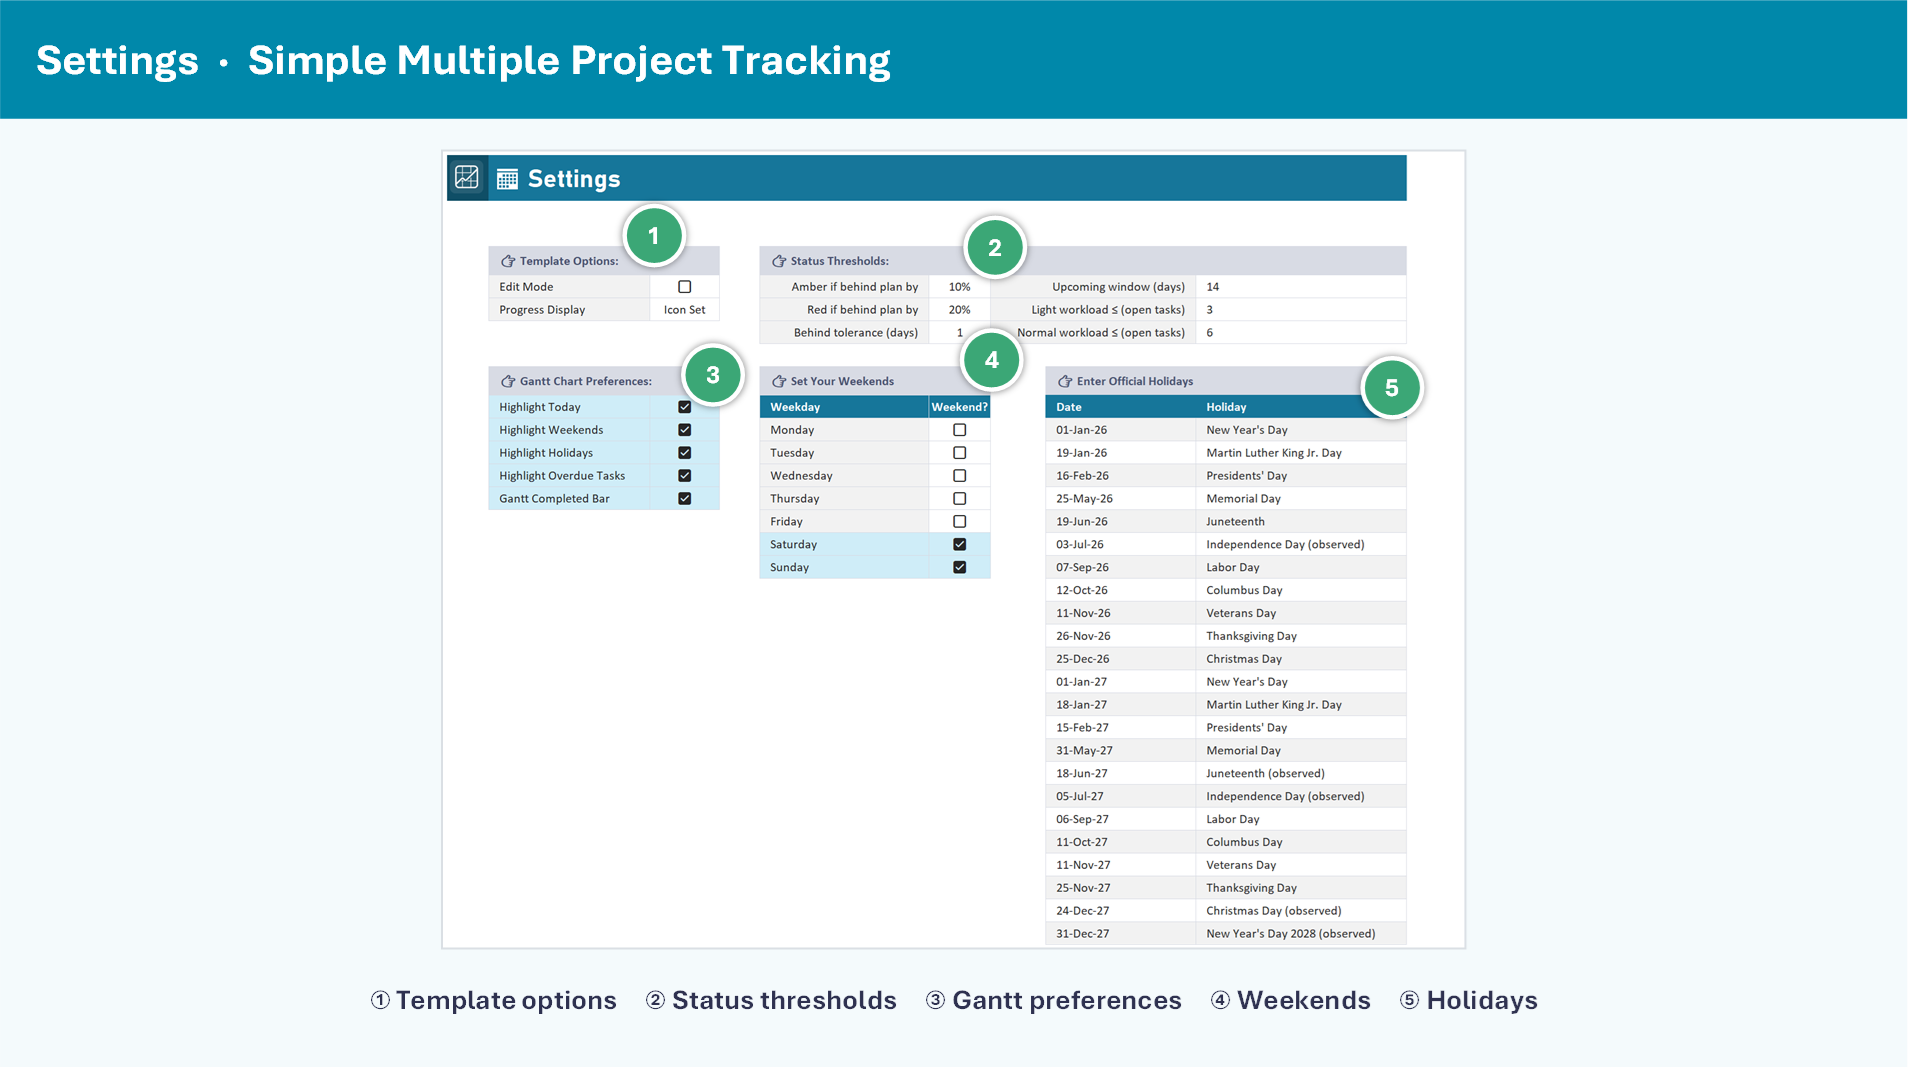
| Setting | What it does | Default |
|---|---|---|
| Edit Mode | Highlights every input cell. | Off |
| Progress Display | Icon Set (traffic lights) or Data Bar for %Completed. | Icon Set |
| Amber if behind plan by | Project turns 🟡 when actual progress trails planned by this much. | 10% |
| Red if behind plan by | Project turns 🔴 (also red when it has any overdue task). | 20% |
| Behind tolerance (days) | Gantt shows coral only when a task is more than this many days behind. | 1 |
| Upcoming window (days) | Days ahead shown in Upcoming Deadlines. | 14 |
| Light / Normal workload ≤ | Open-task limits for Light and Normal; above Normal is Overloaded. | 3 / 6 |
| Highlight Today · Weekends · Holidays · Overdue · Completed Bar | Gantt preferences – tick to show, untick to hide. | On |
| Set Your Weekends | Tick each weekend day (Mon–Sun). | Sat, Sun |
| Holidays | Date + name; up to 60 rows. Skipped in every date calculation. | US 2026–27 |
Light & Dark mode
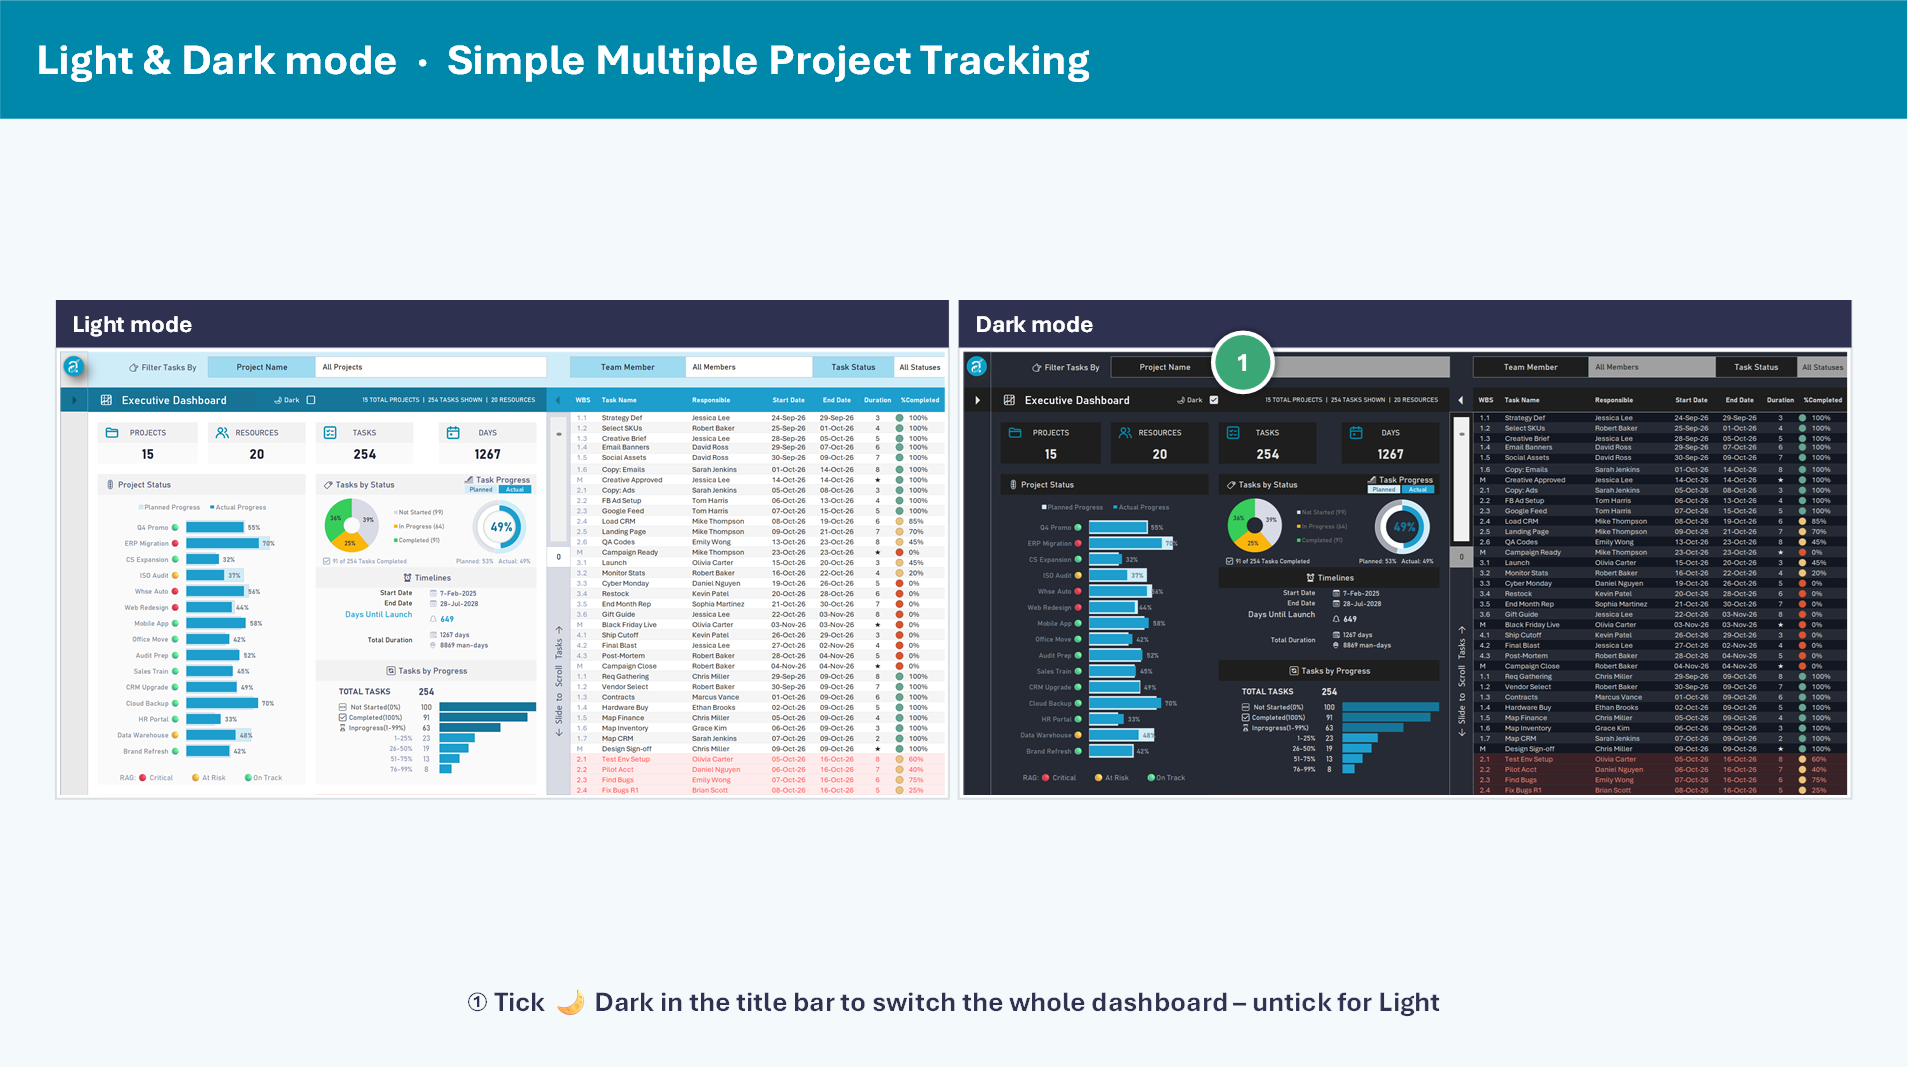
- Tick 🌙 Dark in the Dashboard title bar to switch the whole dashboard to the dark theme; untick for Light.
- In Excel 2016–2024 (no in-cell checkboxes) the cell shows TRUE / FALSE with a dropdown – choose TRUE for Dark.
- Light is best for printing and sharing; Dark is great for big screens and presentations.
Troubleshooting
| Symptom | What to check |
|---|---|
| Dashboard is blank or shows 0 | Filters set to a project/person/status with no tasks – choose All. Make sure Calculation is Automatic. |
| A task is missing from the list | Its Project or Responsible name doesn't match the Projects / Resource sheet exactly – pick from the dropdown. |
| End date looks wrong | Days Required is in working days; check weekends and holidays in Settings. |
| Gantt shows no bars | Scroll the timeline slider back to 0 or select the project – its dates may be outside the 63 columns. Try Week or Month view. |
| #NAME? errors | Your Excel is older than 2016, or the file was opened in Google Sheets / Numbers. Use Excel 2016 or later. |
| Can't type on the Dashboard | It is protected by design. Review › Unprotect Sheet (no password). |
FAQ
Can I see and change the formulas?
Yes. Nothing is password-locked and there are no macros. Unprotect the Dashboard to edit it.
How many projects, people and tasks can it handle?
Up to 500 task rows and about 50 projects and 50 people. Charts are laid out for around 15 projects and 20 people – more will make them busier.
Does it work on Mac?
Yes – Excel 2016 or later for Mac, including Microsoft 365.
Can I change the colours or labels?
Yes. Edit header text directly; RAG and workload limits are in Settings › Status Thresholds.
What's the difference between the Sample Data and Blank editions?
They are identical; the Blank edition simply has empty Projects, Resource and Tasks tables.
Upgrading from v2
- v3 replaces the separate Dark edition – one file now has a Light / Dark switch.
- Copy your v2 data into the v3 Blank edition: Projects (ID, Name), Resource (ID, Name) and Tasks. Add a Task ID for each task (new first column).
- The Lists sheet is now Settings – re-enter your weekends and holidays there.
- Review Status Thresholds – v3 makes the RAG and workload limits editable.
Version history
| Version | Released | Highlights |
|---|---|---|
| 3.0 | 22 Oct 2026 | One file with Light / Dark switch; Day / Week / Month Gantt; milestones; Done / Behind / Remaining bars; Upcoming Deadlines; load strip; editable status thresholds; faster formulas; Task IDs. |
| 2.0 | 10 Feb 2026 | Premium Simple Multiple Project Tracking template: KPI cards, project / member / status filters, resource workload, overdue alerts, 63-day Gantt; separate Dark edition. |
| 1.0 | 1 Sep 2022 | First premium release – full edition of the free Multiple Project Plan template: unlimited projects, tasks and resources, fully unlocked. |
See every change in the full Simple Multiple Project Tracking Template changelog ↗.
Need budgets, RAID and Kanban?
Upgrade to the Ultimate PM Template – or get all 120+ premium project management templates.
💡 Have an idea or found a bug?
Tell us what you'd like to see in the next version or report anything that doesn't work as expected. Many v3 features came from customer requests.
Questions? Email info@analysistabs.org.
How do you change the Theme between Dark and Light Mode?
Hi Tycher,
The template doesn’t have a toggle button to switch themes. Instead, we have included two separate files in your download folder—one for the Light Theme and one for the Dark Theme. You can just pick the file with the theme you like best!
Let me know if you need help finding them.
Thanks,
PNRao