
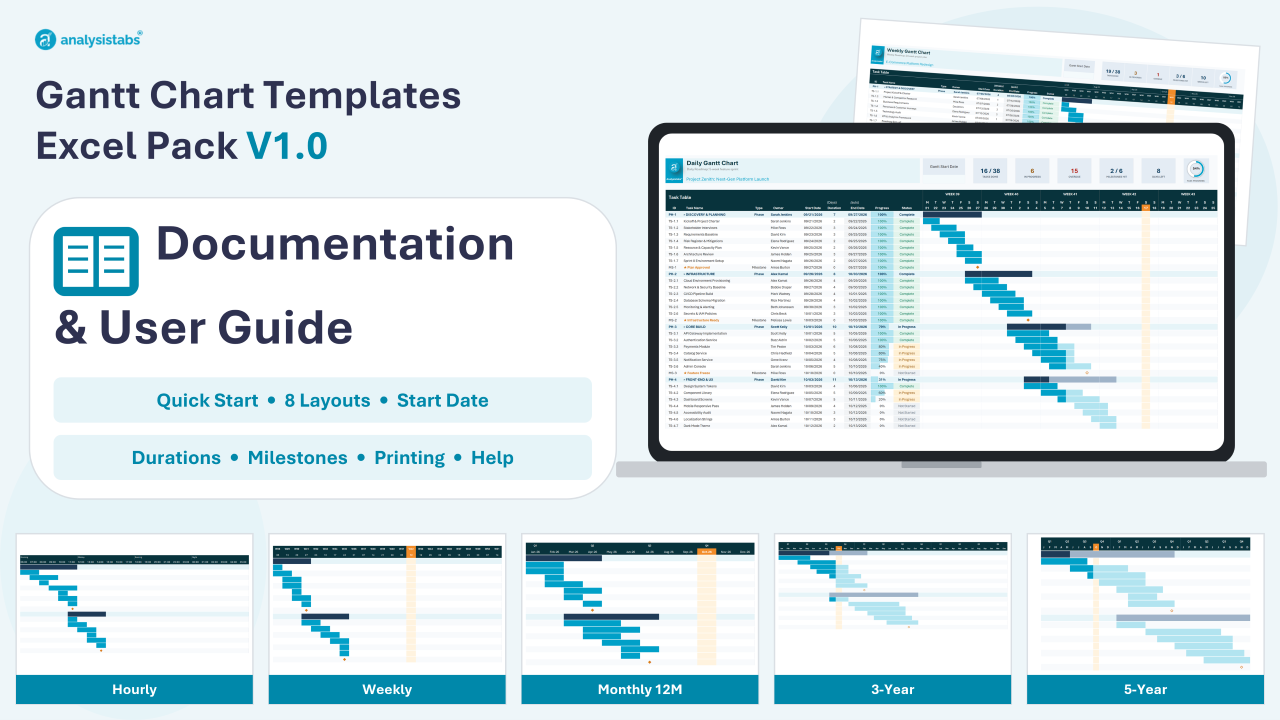
Gantt Chart Templates – User Guide
How to set up and use the Analysistabs Gantt chart templates for Excel – Hourly, Daily, Weekly, 12-Month, 24-Month, 3-Year, 4-Year and 5-Year. Every layout works the same way: fill in the task table, and the timeline, progress bars, milestones and KPI cards update themselves.
Version 1.0Excel 2016 · 2019 · 2021 · 2024 · 365.xlsx · no macros8 layouts · same steps
Requirements · Choose a layout · Quick start · Sheet guide · Screen layout · Entering tasks · Gantt Start Date · Duration units · Phases & milestones · Progress, status & KPIs · Hourly layout · Printing & sharing · Troubleshooting · FAQ · Version history
Requirements
- Excel 2016, 2019, 2021, 2024 or Microsoft 365 on Windows or Mac. Excel 2013 and older, Google Sheets and Apple Numbers are not supported.
- Standard
.xlsxworkbooks – no macros, no add-ins, nothing to enable. - Calculation mode must be Automatic (Formulas › Calculation Options). If the chart looks stale, press
F9. - Each layout ships as its own workbook with two sheets: a sample sheet with a realistic project, and a _Blank sheet that is empty and ready for your own plan.
Choose a layout
Pick the layout that matches how long your project runs. The table, columns and steps are identical in every layout – only the timeline scale changes.
| Layout | Timeline shows | Duration in | Best for |
|---|---|---|---|
| Hourly | 24 hours, one column per hour | Hours | Launch days, events, shift plans, cut-overs |
| Daily | 5 weeks, one column per day | Days | Sprints and projects up to about a month |
| Weekly | 24 weeks, one column per week | Weeks (or days) | Projects of 1–6 months |
| 12-Month | 12 months, grouped by quarter | Months (or days) | Annual plans and 6–12 month projects |
| 24-Month | 24 months | Months (or days) | Two-year programmes |
| 3-Year | 36 months | Months (or days) | Construction and capital projects |
| 4-Year | 48 months | Months (or days) | Long programmes and multi-phase rollouts |
| 5-Year | 60 months | Months (or days) | Strategic roadmaps and portfolio plans |
Quick start – 6 steps
- 1Open the _Blank sheetWith no tasks entered, the timeline starts at today.
- 2Name your projectOverwrite the project name and the Project Objective line under the title.
- 3Add phases, tasks and milestonesOne row each: ID, Task Name, Type (blank = task, or Phase / Milestone), Owner, Start Date and Duration. End Date calculates itself.
- 4Update progressType Progress (0–100%) for each task and pick a Status. Bars fill with completed work and the KPI cards update.
- 5Move the window if neededLeave Gantt Start Date blank to start at your earliest task, or type a date to jump the timeline to it.
- 6Print or shareEach sheet is set up to print or save as PDF straight away.
Sheet guide
| Sheet | What it is for |
|---|---|
| [Layout] Gantt Chart | Sample project with phases, tasks and milestones showing every feature working. |
| [Layout] Gantt Chart_Blank | Same layout and formulas with an empty task table – use this for your own project. |
| License | Licence terms and brand verification. Keep this sheet in the workbook – the Gantt sheet reads it, and the chart goes blank without it. |
Screen layout
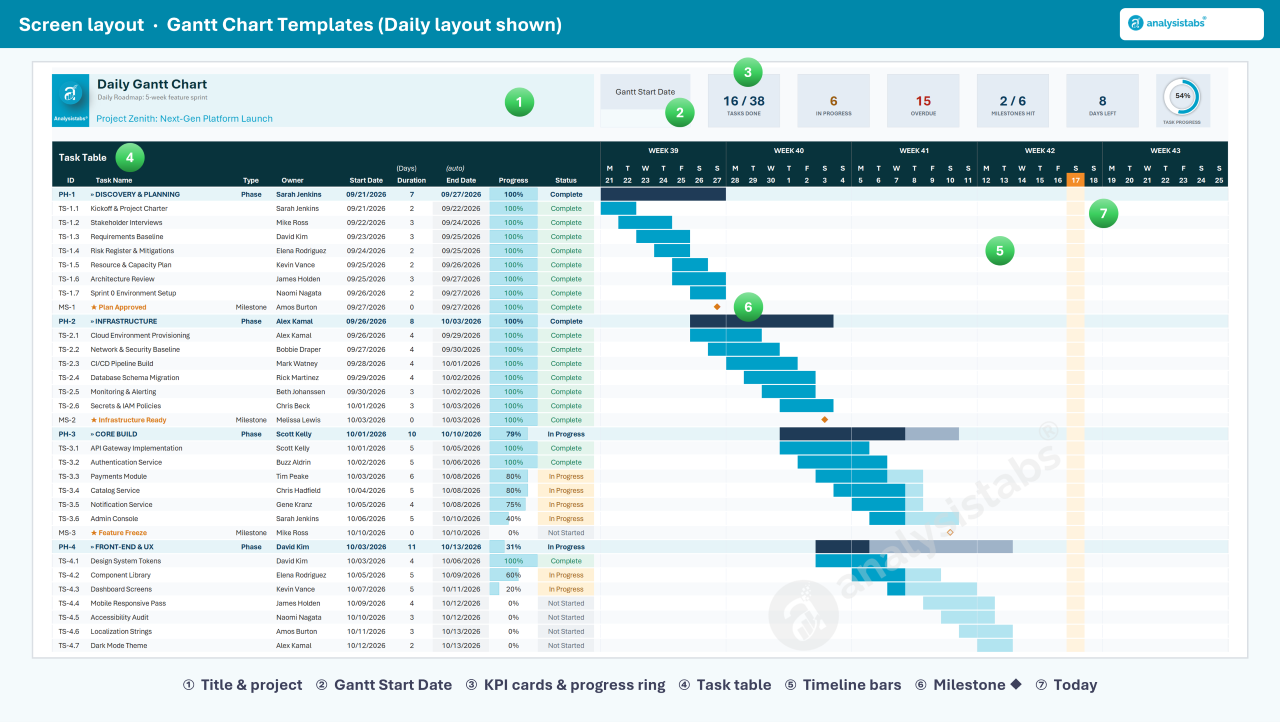
Title and KPI cards on top, the task table on the left and the timeline on the right.
| Area | What you see |
|---|---|
| Title band | Project name and objective, the Gantt Start Date input, KPI cards (Tasks Done, In Progress, Overdue, Milestones Hit, Days / Weeks / Months Left) and an overall progress ring. |
| Task table | ID, Task Name, Type, Owner, Start Date, Duration, End Date, Progress and Status – 100 rows ready to fill. |
| Timeline | Period headers (weeks, days, months or quarters), bars that fill with progress, ◆ milestone markers, phase summary bars and a highlight on today's column. |
| How to use box | A short reminder of the steps, below the task table. |
Entering tasks
| Column | Type it? | What to enter |
|---|---|---|
| ID | Yes | Any short code, e.g. PH-1 for a phase, TS-1.1 for a task, MS-1 for a milestone. |
| Task Name | Yes | The task, phase or milestone name. A row counts only when it has a name. |
| Type | Dropdown | Leave blank (or Task) for a task, or pick Phase or Milestone. |
| Owner | Yes | Who is responsible. |
| Start Date | Yes | A real date, e.g. 01/15/2026. Press Ctrl+; for today. |
| Duration | Yes | How long the task runs, in the unit shown under the header. See Duration units. |
| End Date | Auto | Calculated from Start Date and Duration. Don't type here. |
| Progress | Yes (tasks) | 0% to 100% – type 50% or 0.5. Phase rows calculate their own progress. |
| Status | Dropdown | Not Started, In Progress, Complete, On Hold or Overdue. |
Phases
Set Type to Phase to draw a dark summary bar and shade the row. Its Progress is the duration-weighted average of the tasks beneath it, up to the next phase.
Milestones
Set Type to Milestone. A ◆ marker appears on its start date – filled when complete, outlined while still open.
Add more rows
Insert rows inside the task table (above the last row), then copy the row above down with Ctrl+D so the End Date formula comes too. Counts and KPI cards include the new rows.
Pasting data
Use Paste › Values (Ctrl+Alt+V › V) so you keep the table's formats and dropdowns. Dropdowns block typed mistakes, not pasted ones.
Gantt Start Date
Every layout has an optional Gantt Start Date cell in the title band:
- Leave it blank – the timeline starts at your earliest task.
- Type a date – the timeline jumps to that date. Use it to look ahead or to show the current period in a status meeting.
- Empty task table – the timeline starts at today, so the _Blank sheet always opens on the current period.
The Daily layout always begins on a Monday, and the monthly and multi-year layouts begin on the first of a month.
Duration units
The unit sits in brackets under the Duration header. In the Weekly and monthly / multi-year layouts it is a dropdown, so you can switch the whole sheet to days if you prefer to plan in days.
| Layout | Unit options | End Date is |
|---|---|---|
| Hourly | Hours | Start Date + Start Time + Duration hours. |
| Daily | Days | Start Date + Duration − 1 calendar days (a 1-day task ends the same day). |
| Weekly | (Weeks) or (Days) | Start Date + Duration × 7 − 1 days, or + Duration − 1 days. |
| 12-Month to 5-Year | (Months) or (Days) | The day before the same date Duration months later, or + Duration − 1 days. |
Durations count calendar days, including weekends.
Phases & milestones
- Put a Phase row above each group of tasks. Everything until the next Phase row belongs to it.
- Phase progress is worked out for you; milestones are left out of the calculation.
- A Milestone is a single date. Give it a Start Date; Duration can be 0.
- Phase rows are left out of the task counts on the KPI cards. Milestones Hit counts milestones with Status Complete.
Progress, status & KPIs
| KPI card | How it's counted |
|---|---|
| Tasks Done | Tasks (not phases) with Status Complete, out of all named tasks. |
| In Progress | Tasks with Status In Progress. |
| Overdue | Tasks with Status Overdue, plus unfinished tasks whose End Date has passed and Progress is below 100%. |
| Milestones Hit | Complete milestones out of all milestones. |
| Days / Weeks / Months Left | Time from today to the last End Date in the plan. |
| Progress ring | Overall completion of the project. |
Bars fill dark for the completed share and light for what's left, so you can read progress straight off the timeline.
Hourly layout
The Hourly layout works like the others with three differences:
- The task table has an extra Start Time column. Type a time such as 06:00 or 14:30.
- Duration is in hours (decimals allowed – 1.5 = 90 minutes) and End Time calculates itself.
- Next to Gantt Start Date there is a Gantt Start Hour (0–23). Leave both blank to start at your first task, or set them to jump to a given hour. The current hour is highlighted.
Printing & sharing
- File › Print, or File › Save As › PDF. Each sheet is set to fit the page width.
- To keep a copy before a big change, right-click the sheet tab › Move or Copy › Create a copy.
- For a new project, copy the _Blank sheet rather than clearing the sample.
Troubleshooting
| Symptom | What to check |
|---|---|
| The timeline and KPI cards are blank | The License sheet or the Analysistabs® brand cell has been removed or changed. Restore them from your original download. |
| A task has no bar | Check Task Name, Start Date and Duration are filled in and Start Date is a real date (not text). Then check the task falls inside the visible window – change Gantt Start Date. |
| A bar is shorter or longer than expected | Check the Duration unit under the header – Weeks, Months or Days. |
| A new row isn't counted | Rows added below the last table row aren't included. Insert rows inside the table and copy the formulas down. |
| A milestone doesn't show | Type must be Milestone and Start Date must be inside the visible window. |
| ##### in the date headers | Widen the columns slightly or zoom in – the date is too long for the cell. |
| Numbers don't update | Formulas › Calculation Options › Automatic, or press F9. |
FAQ
Can I see and change the formulas?
Yes. Nothing is password-locked and there are no macros. Keep the License sheet and the brand cell in place – the formulas check them.
How many tasks can I add?
Each sheet has 100 rows ready, and you can insert more inside the table whenever you need them.
Can I track more than one project?
Yes – one sheet per project. Copy the _Blank sheet for each new plan.
Do weekends and holidays get skipped?
No. These layouts count calendar days. If you need working-day scheduling, holidays and an owner dashboard, see Multi-View Gantt Chart Pro.
Does it work on Mac and Excel for the web?
Yes on Excel for Mac 2016 or later and Microsoft 365. Excel for the web opens and edits it; printing may differ slightly.
Is it a subscription?
No. One-time payment, instant download.
Version history
| Version | Released | Notes |
|---|---|---|
| 1.0 | 12 Oct 2026 | First release – Hourly, Daily, Weekly, 12-Month, 24-Month, 3-Year, 4-Year and 5-Year layouts, each with sample and blank sheets. |
Don't have the templates yet?
One-time payment · instant download · sample + blank sheets for every layout.
Questions? Email info@analysistabs.com.