
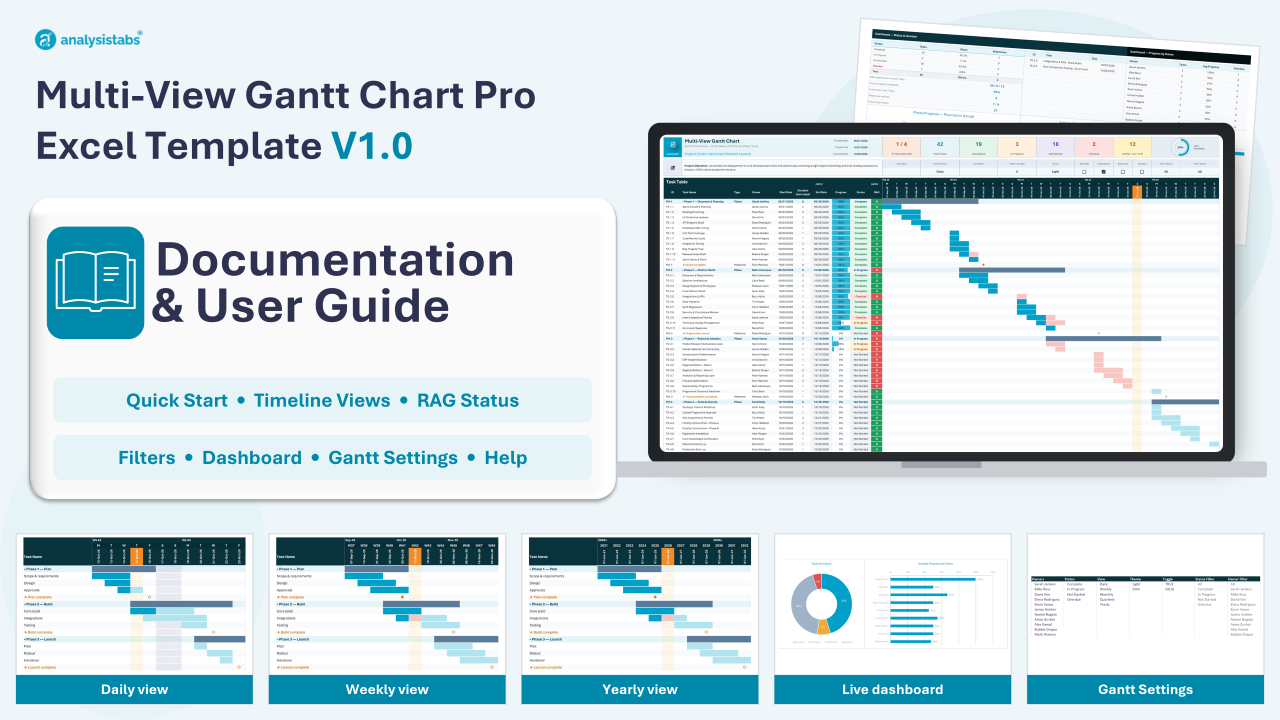
Multi-View Gantt Chart Pro – User Guide
How to set up, fill in and use the Multi-View Gantt Chart Pro template. One task list, five timeline views (Daily, Weekly, Monthly, Quarterly, Yearly), automatic RAG status and a live dashboard. Work top to bottom the first time; after that, just keep the task table up to date.
Version 1.0Excel 2016 · 2019 · 2021 · 2024 · 365.xlsx · no macrosUnlimited task rows
Requirements · Quick start · Sheet guide · Screen layout · Entering tasks · Control bar · Timeline views · Weekends & holidays · Status & RAG · Filters · Dashboard · Gantt Settings · Troubleshooting · FAQ · Version history
Requirements
- Excel 2016, 2019, 2021, 2024 or Microsoft 365 on Windows or Mac. Excel 2013 and older, Google Sheets and Apple Numbers are not supported.
- A standard
.xlsxworkbook – no macros, no add-ins, nothing to enable. - Calculation mode must be Automatic (Formulas › Calculation Options). If the timeline looks stale, press
F9. - You receive one workbook with two Gantt sheets: Gantt Chart Multi-View (sample project to explore every feature) and Gantt Chart Multi-View_Blank (empty, ready for your own project), plus the shared Gantt Settings sheet.
Quick start – 7 steps
- 1Set up your listsOpen Gantt Settings. Type your team names in the Owners column, replace the sample holidays with your own, and tick your company weekend days. Every dropdown on the Gantt sheet updates automatically.
- 2Open the _Blank sheetGo to Gantt Chart Multi-View_Blank. With no tasks entered, the timeline starts at today.
- 3Name your projectOverwrite the project title and the Project Objective line at the top of the sheet.
- 4Enter phases, tasks and milestonesOne row each: Task Name, Type (blank = task, or Phase / Milestone), Owner, Start Date and Duration in work days. End Date and RAG calculate themselves.
- 5Update progressType Progress (0–100%) and pick a Status. Bars fill with completed work and the KPI cards and dashboard update instantly.
- 6Pick a viewChange Timeline View to Daily, Weekly, Monthly, Quarterly or Yearly. Use Start Date or Shift (± periods) to move the window.
- 7Review and shareCheck the Project Summary line and the dashboard, filter by owner or status for stand-ups, and print or share the sheet.
Sheet guide
| Sheet | What it is for |
|---|---|
| Gantt Chart Multi-View | Sample project (4 phases, 42 tasks, milestones) showing every feature working with realistic data. |
| Gantt Chart Multi-View_Blank | Same layout, formulas and dashboard with an empty task table – use this for your own project. |
| Gantt Settings | Owners, statuses, timeline views, themes, holiday calendar, company weekends and RAG thresholds. Edit the light-blue cells. |
| License | Licence terms and brand verification. Keep this sheet in the workbook – the Gantt sheets read it, and the timeline goes blank without it. |
Screen layout
The Gantt sheet reads top to bottom in six bands:
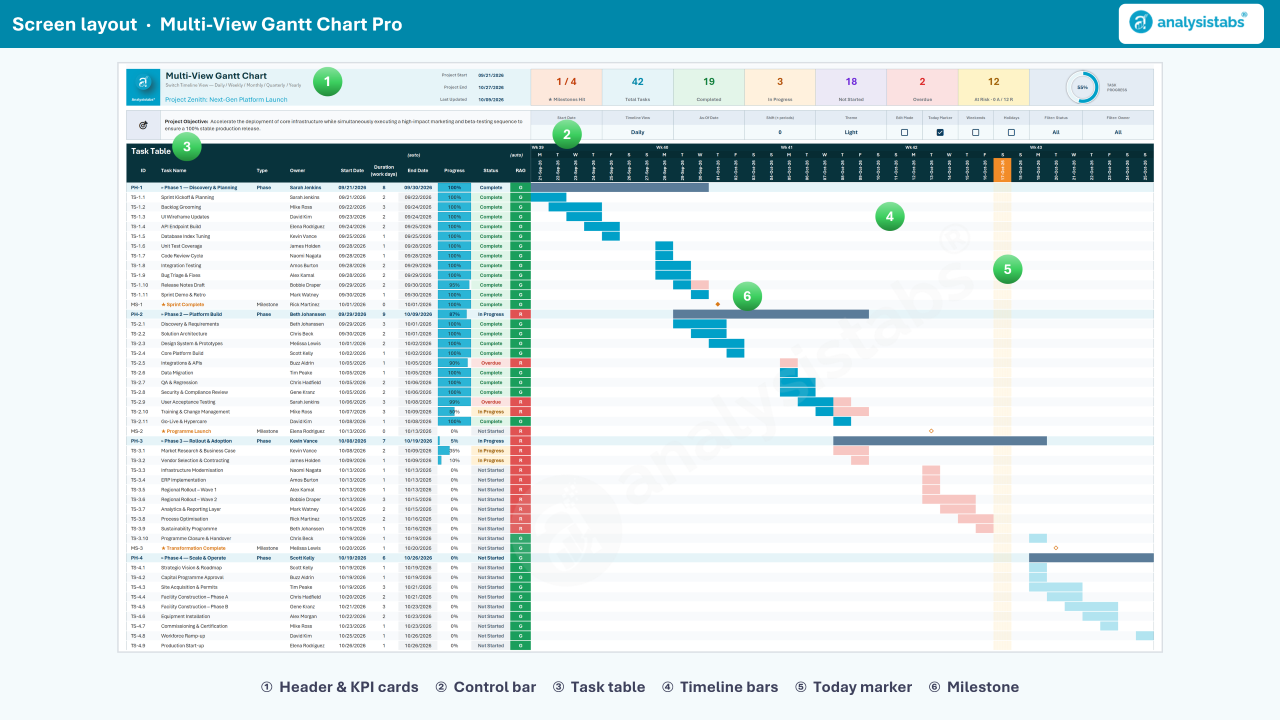
Header and KPI cards, control bar, task table with timeline, period summary, project summary and dashboard.
| Band | What you see |
|---|---|
| Header & KPI cards | Project title, objective, Project Start / End and Last Updated, a progress ring, and cards for ★ Milestones Hit, Total Tasks, Completed, In Progress, Not Started, Overdue and At Risk. |
| Control bar | Start Date, Timeline View, As-Of Date, Shift, Theme, Edit Mode, Today Marker, Weekends, Holidays and the two filters. See Control bar. |
| Task table + timeline | Your tasks on the left; bars, milestones, today marker, weekends and holidays on the right. |
| Period summary | Three rows under the timeline: Tasks starting in period, Tasks due in period and Completed (due in period). The busiest periods are highlighted. |
| Legend & Project Summary | Colour key, then an auto-written sentence: percentage complete, tasks done / in progress / not started and the next milestone. |
| Dashboard | Status & Overdue, Progress by Owner, Milestones list and four charts. See Dashboard. |
Entering tasks
| Column | Type it? | What to enter |
|---|---|---|
| ID | Yes | Any short code. The sample uses PH-1 for phases, TS-1.1 for tasks and MS-1 for milestones. |
| Task Name | Yes | The task, phase or milestone name. A row counts only when it has a name. |
| Type | Dropdown | Leave blank (or Task) for a task, or pick Phase or Milestone. |
| Owner | Dropdown | Pick from the Owners list on Gantt Settings. |
| Start Date | Yes | A real date, e.g. 01/15/2026. Press Ctrl+; for today. |
| Duration (work days) | Yes | Working days, excluding your company weekends and holidays. Enter 0 for a milestone. |
| End Date | Auto | Calculated from Start Date + Duration in working days. Don't type here. |
| Progress | Yes | 0% to 100% – type 50% or 0.5. |
| Status | Dropdown | Complete, In Progress, Not Started or Overdue. |
| RAG | Auto | R / A / G health flag. See Status & RAG. |
Phases
Set Type to Phase to draw a summary bar and group the tasks below it. Phases are left out of the task counts on the KPI cards.
Milestones
Set Type to Milestone, or enter Duration 0. A ◆ marker appears on its date – filled when Complete, outlined while still open.
Add more rows
Insert rows inside the task table (above the last task row), then copy the row above down with Ctrl+D so End Date and RAG come with it. Every count, chart and summary expands to include the new rows.
Pasting data
Use Paste › Values (Ctrl+Alt+V › V) so you keep the table's formats and dropdowns. Dropdowns block typed mistakes, not pasted ones.
Control bar
All the controls sit in one row above the timeline. Leave optional cells blank to use the defaults.
| Control | What it does |
|---|---|
| Start Date | Optional. Blank = the timeline starts at your earliest task (or today when the table is empty). Type a date to jump the window to it. |
| Timeline View | Daily, Weekly, Monthly, Quarterly or Yearly. The bars, headers, period summary and the Tasks Due chart all follow it. |
| As-Of Date | Optional. Blank = today. Type a date to see the plan, RAG and today marker as of that day – useful for month-end reports. |
| Shift (± periods) | Moves the window forward (+) or back (−) by whole periods of the current view, without changing Start Date. |
| Theme | Light or Dark. |
| Edit Mode | TRUE highlights the cells you can type in; FALSE gives a clean view for printing and sharing. |
| Today Marker | Shows or hides the As-Of / today column on the timeline. |
| Weekends / Holidays | Shade non-working days on the timeline (Daily view). |
| Filter: Status / Filter: Owner | Grey out every task that doesn't match. Pick All to clear. |
Timeline views
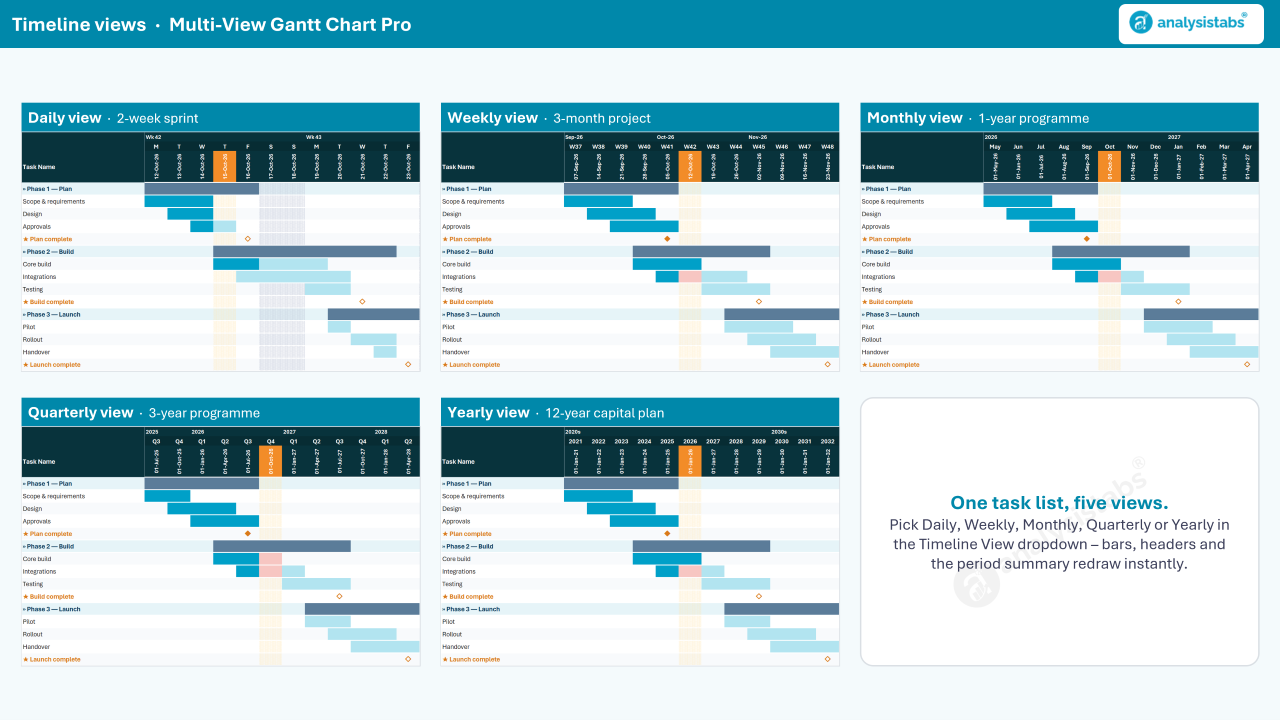
One task list, five views – switch with the Timeline View dropdown.
- Daily – one column per day with weekday initials, week numbers, weekend and holiday shading.
- Weekly – one column per week; best for sprints and 1–6 month projects.
- Monthly – one column per month; best for 6–24 month programmes.
- Quarterly and Yearly – roadmap views for multi-year portfolios.
A bar fills with the completed share of the task (Progress) and shows the remaining share in a lighter tint. Late, unfinished work is flagged as overdue on the timeline.
Weekends & holidays
- Company weekends: on Gantt Settings, set TRUE against each non-working day (default Saturday and Sunday). End Dates skip these days.
- Holidays: list them in the Holiday Date / Holiday Name table on Gantt Settings. The sample has US federal holidays for 2026 – replace them with your own. End Dates skip holidays too.
- Turn on Weekends and Holidays in the control bar to shade those days on the Daily timeline.
Status & RAG
Status is what you pick. RAG is worked out for you by comparing planned progress (time elapsed at the As-Of date) with actual Progress:
| RAG | When |
|---|---|
| R | Behind plan by more than the Red threshold (default 25%), Status is Overdue, or the End Date has passed and the task isn't finished. |
| A | Behind plan by more than the Amber threshold (default 10%). |
| G | Status is Complete or Progress is 100%, or the task is on plan. |
Change the thresholds and the Upcoming window (days) used by the dashboard on Gantt Settings.
Filters
Use Filter: Status and Filter: Owner on the control bar to focus a review. Rows that don't match are greyed out rather than hidden, so the plan keeps its shape and nothing is accidentally deleted. Phases always stay visible. Set both filters back to All when you're done.
Dashboard
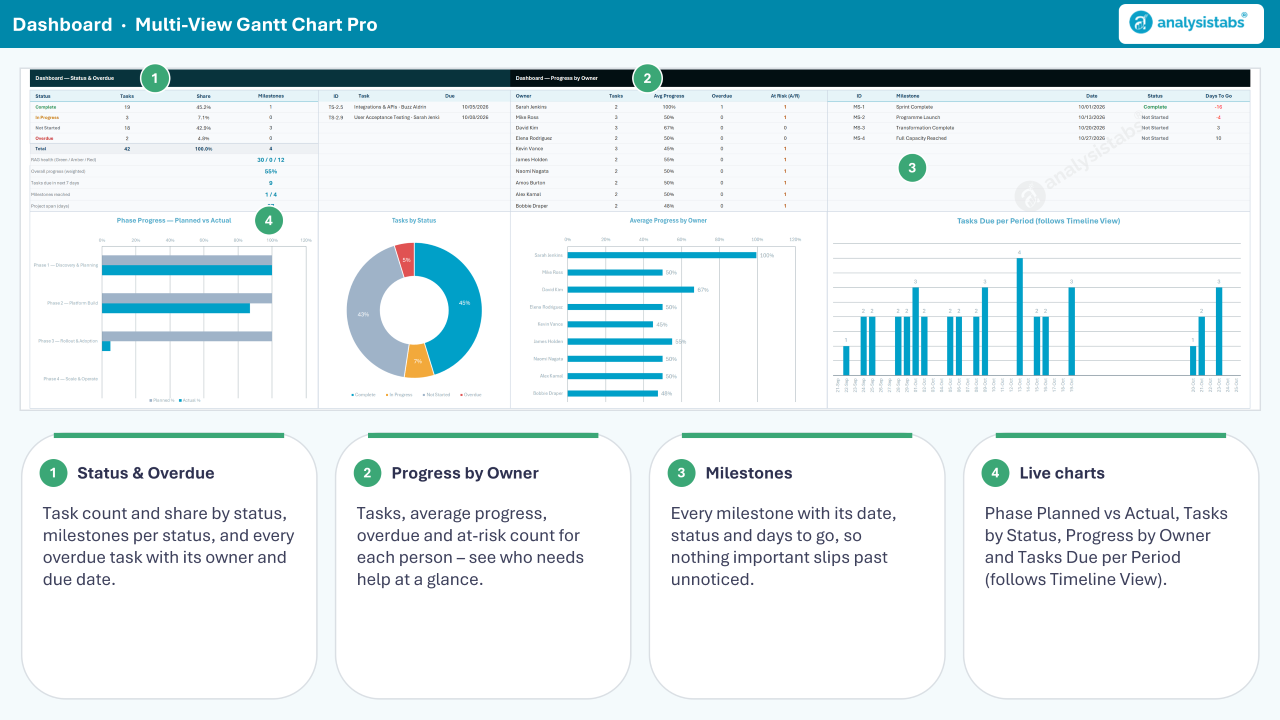
Status & Overdue, Progress by Owner, Milestones and four live charts.
- Status & Overdue – task count and share by status, milestones per status, and a list of overdue tasks with owner and due date.
- Progress by Owner – tasks, average progress, overdue and at-risk count for each owner.
- Milestones – every milestone with date, status and days to go.
- Charts – Tasks by Status, Average Progress by Owner, Phase Progress (Planned vs Actual) and Tasks Due per Period (follows the Timeline View).
Gantt Settings
| List | Notes |
|---|---|
| Owners | Your team. Type in the first empty row – the Owner dropdown and Owner Filter grow automatically. Keep one spare row below the last name. |
| Status | Complete, In Progress, Not Started, Overdue. These drive the dashboard – don't rename them. |
| View / Theme / Toggle | Values behind the Timeline View, Theme and on/off dropdowns. Leave as they are. |
| Status Filter / Owner Filter | Formula columns that add 'All' to each list. Don't type here. |
| Holidays | Date and name for each holiday. Add or remove rows freely. |
| RAG thresholds | Amber and Red gaps, and the Upcoming window in days. |
| Company Weekends | TRUE for each non-working day. |
Troubleshooting
| Symptom | What to check |
|---|---|
| The whole timeline and KPI cards are blank | The License sheet or the Analysistabs® brand cell has been removed or changed. Restore them from your original download. |
| A task has no bar | Check Task Name, Start Date and Duration are filled in, and that Start Date is a real date (not text). Then check the task is inside the visible window – use Start Date or Shift. |
| End Date is later than expected | Duration is in work days; weekends and holidays from Gantt Settings are skipped. |
| A new row isn't counted | Rows added below the table's last row aren't included. Insert rows inside the table and copy the formulas down. |
| Rows look greyed out | A Status or Owner filter is active. Set both to All. |
| Everything is RAG Red | Check As-Of Date – a date far in the future makes every unfinished task overdue. Clear it to use today. |
| A new owner isn't in the dropdown | Type it directly beneath the last owner on Gantt Settings, with no blank rows between. |
| Numbers don't update | Formulas › Calculation Options › Automatic, or press F9. |
FAQ
Can I see and change the formulas?
Yes. Nothing is password-locked and there are no macros. Keep the License sheet and the brand cell in place – the formulas check them.
How many tasks can it handle?
There's no fixed limit – insert as many rows as your project needs. The sample has 50 rows.
Can I track more than one project?
Use one sheet per project: copy the _Blank sheet (right-click the tab › Move or Copy › Create a copy). All copies share the same Gantt Settings lists.
Does it work on Mac and Excel for the web?
Yes on Excel for Mac 2016 or later and Microsoft 365. Excel for the web opens and edits it; printing layouts may differ slightly.
Can I print or share it?
Set Edit Mode to FALSE for a clean view, pick the Timeline View you want, then File › Print or export to PDF.
Is it a subscription?
No. One-time payment, instant download.
Version history
| Version | Released | Notes |
|---|---|---|
| 1.0 | 12 Oct 2026 | First release – five timeline views, automatic RAG, filters, Light/Dark themes, dashboard and Gantt Settings. |
Don't have the template yet?
One-time payment · instant download · sample + blank sheets · unlimited task rows.
Questions? Email info@analysistabs.com.